Stress Testing ECS Fargate with AWS Distributed Load Testing

Craig Gray
DevOps EngineerUnderstanding the expected performance of a system is essential for maintaining service levels of the system. Using the AWS solution, Distributed Load Testing, we were able to test one of our latest features on Amazon ECS Fargate without the hassle of setting up a test harness, and managed to find a bug in our scaling policy during the process.
Introduction
In a traditional three-tier web architecture, Web, Application and Data Tiers all reside on separate dedicated servers. Usually there's at least two servers in each of these tiers for geographic diversity and high availability. With these servers comes operational complexity, and an operational burden to deploy, monitor, operate and upgrade.
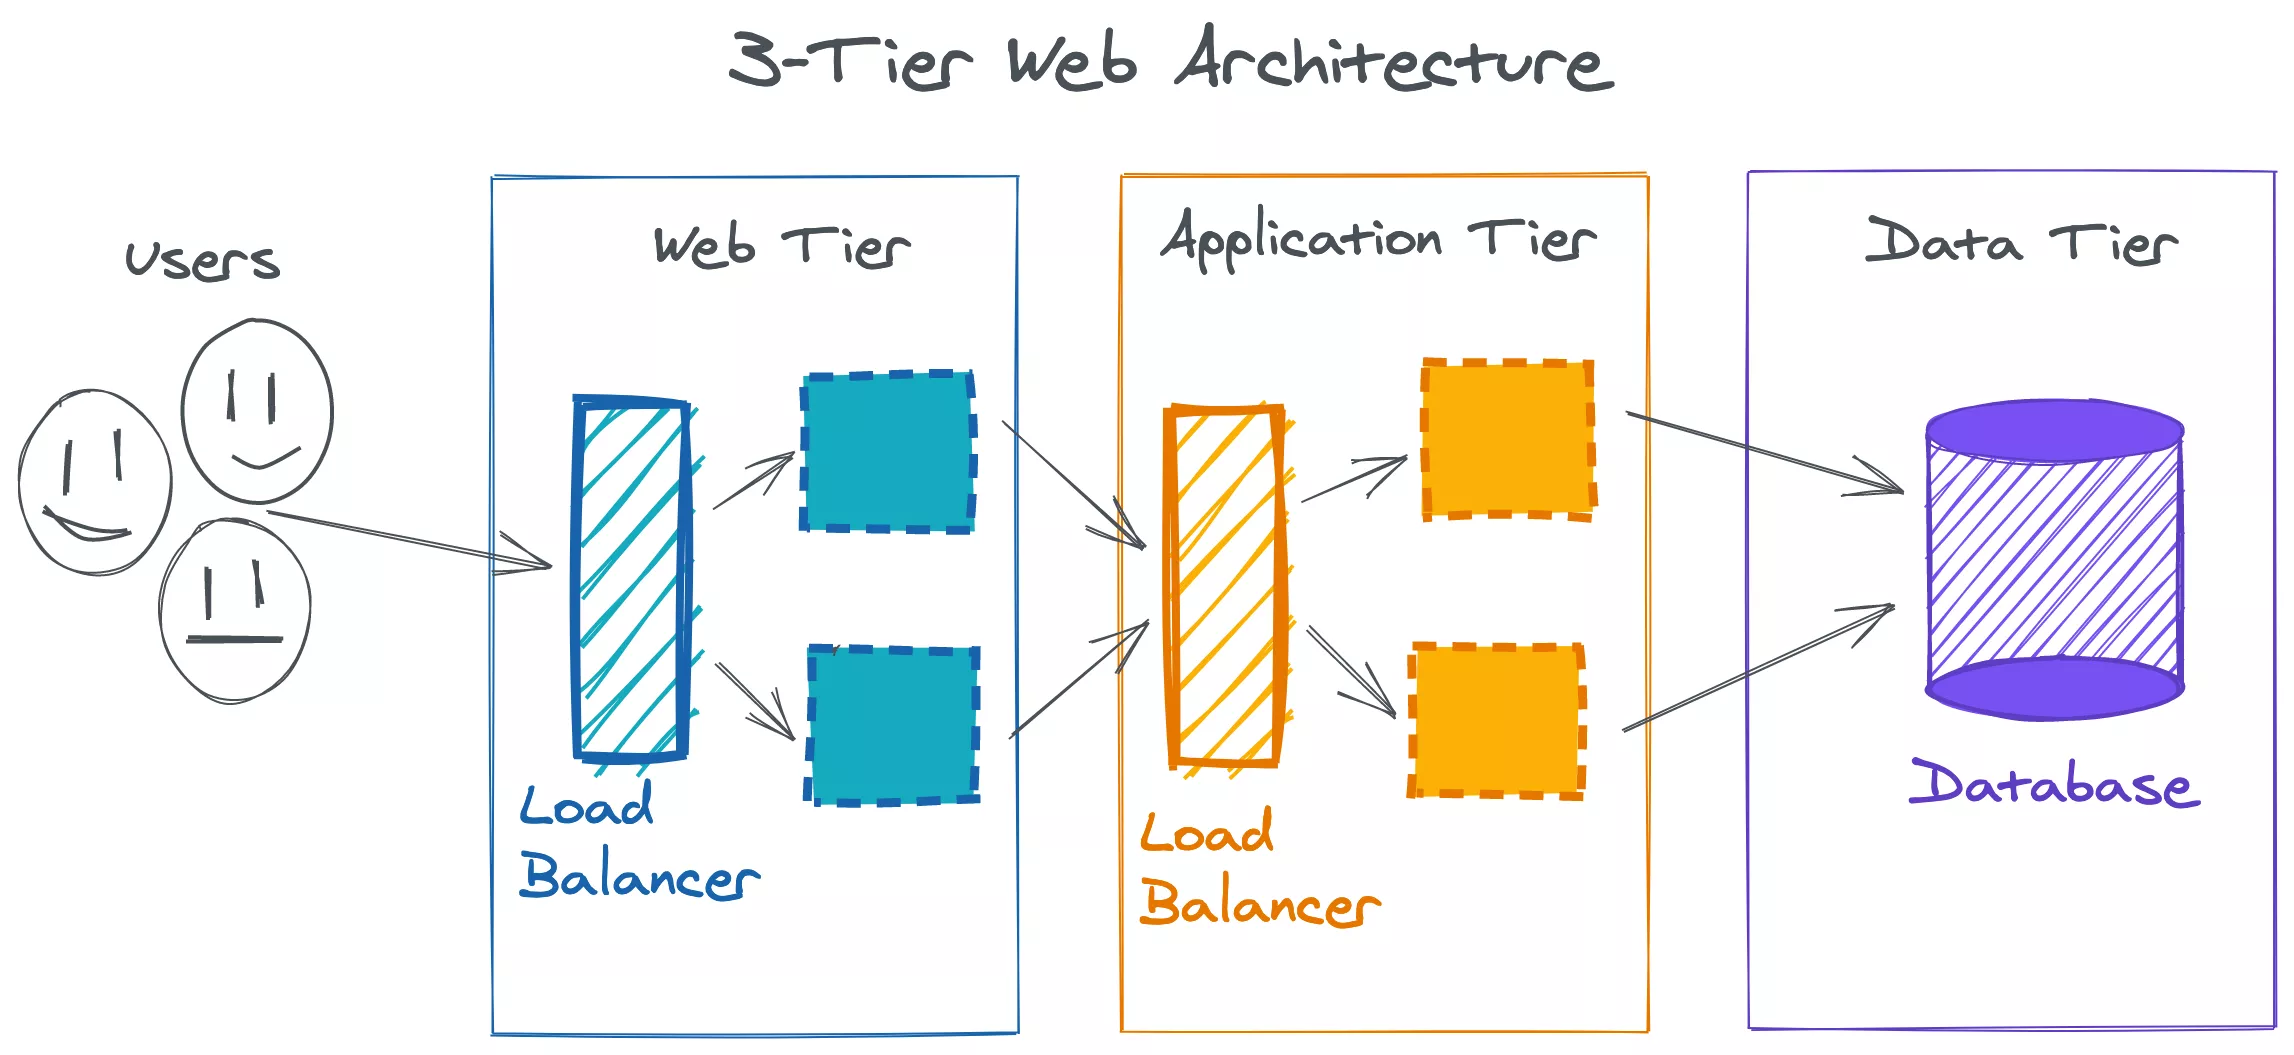
Running applications on Amazon ECS Fargate with the Amazon ALB is a great way to reduce operational complexity by removing the need to manage any servers. At Assignar, where possible we operate on serverless technologies like AWS Lambda and AWS Fargate which allows us to focus on the product and reduce our operational costs. In most cases, our services look very similar to typical three-tier applications, only serverless. These smaller three-tier services (micro-services) interact to form a distributed system.
An important step for managing this distributed system, or any distributed system, serverless or not, is to understand when services become saturated. One way to understand a service's saturation point is to perform a stress test to measure the capacity and reliability of the system under critical load. The AWS Well-Architected framework outlines a key design principle to consider when operating reliable systems; Stop guessing capacity. AWS recently released a tool to help with this; Distributed Load Testing.
Stress Testing
We took a two step approach to measure the saturation point of our service. Step 1, find the breaking point of a single node. Step 2, scale horizontally and find the the breaking point of the entire system.
Step 1 - Breaking a Single Node
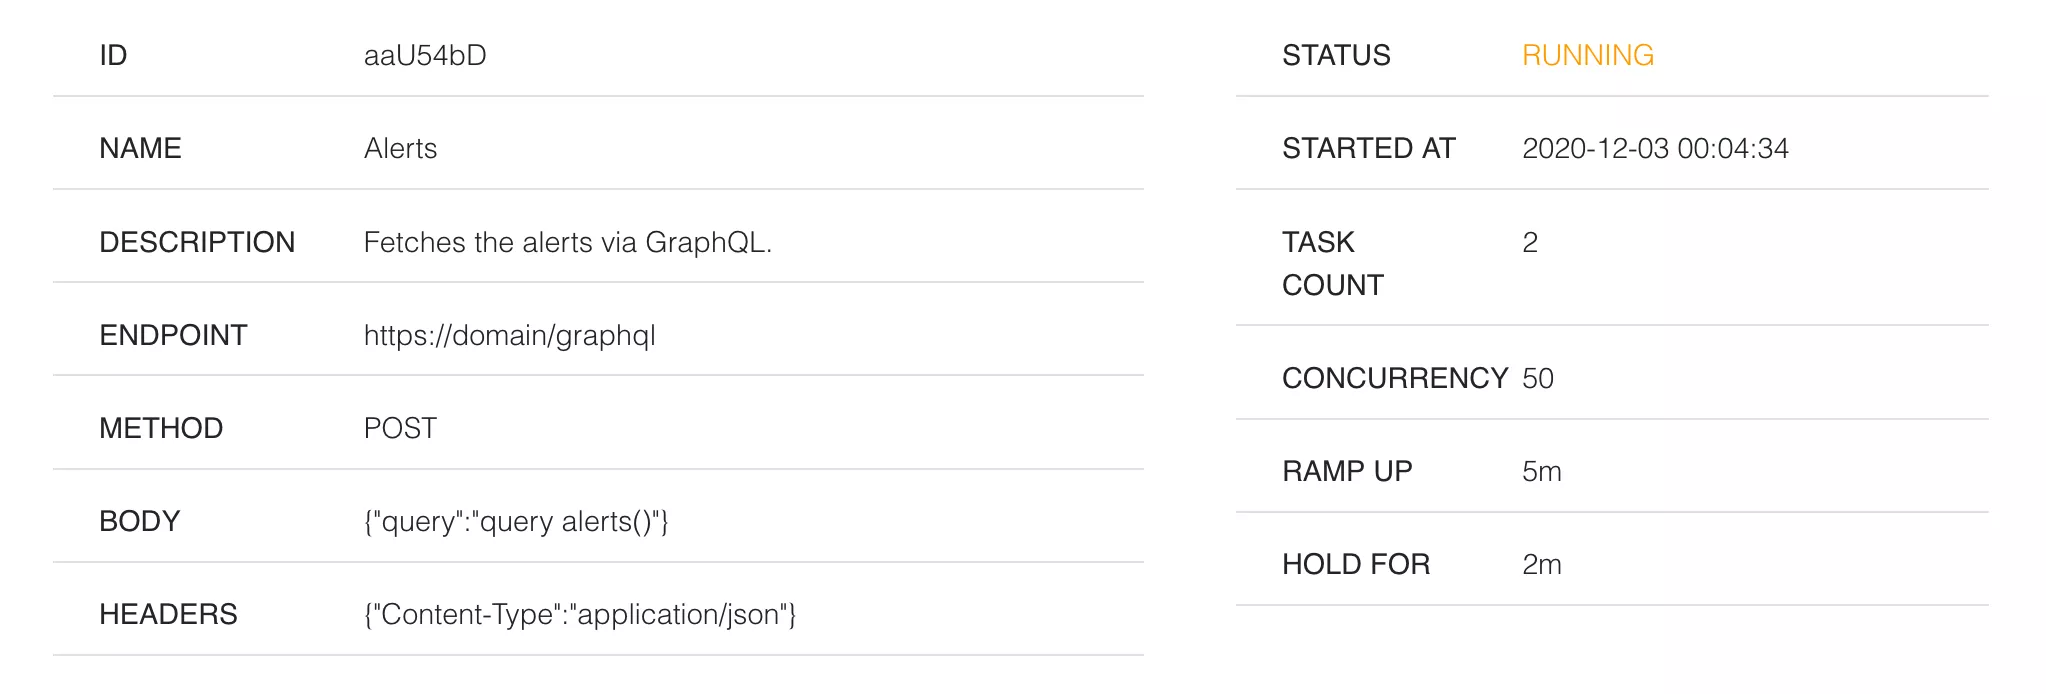
The first and probably most important consideration when performing a stress test or load test is to select some meaningful and realistic test scenarios. Our test scenario below performs a stress test against one of our expensive GraphQL API operations, which is used to fetch alerts for customers.
In the Distributed Load Testing web console, we set the target endpoint to our GraphQL HTTP endpoint, the HTTP method to POST and the body of the request to our GraphQL query. We configured the test to ramp from 0 to 100 concurrent requests over 5 minutes. The hold time was configured to hold at 100 concurrent requests for 2 minutes. The node we are testing against is configured with 1 vCPU and 2GB of Memory.
With the above configuration, we observed the results below.
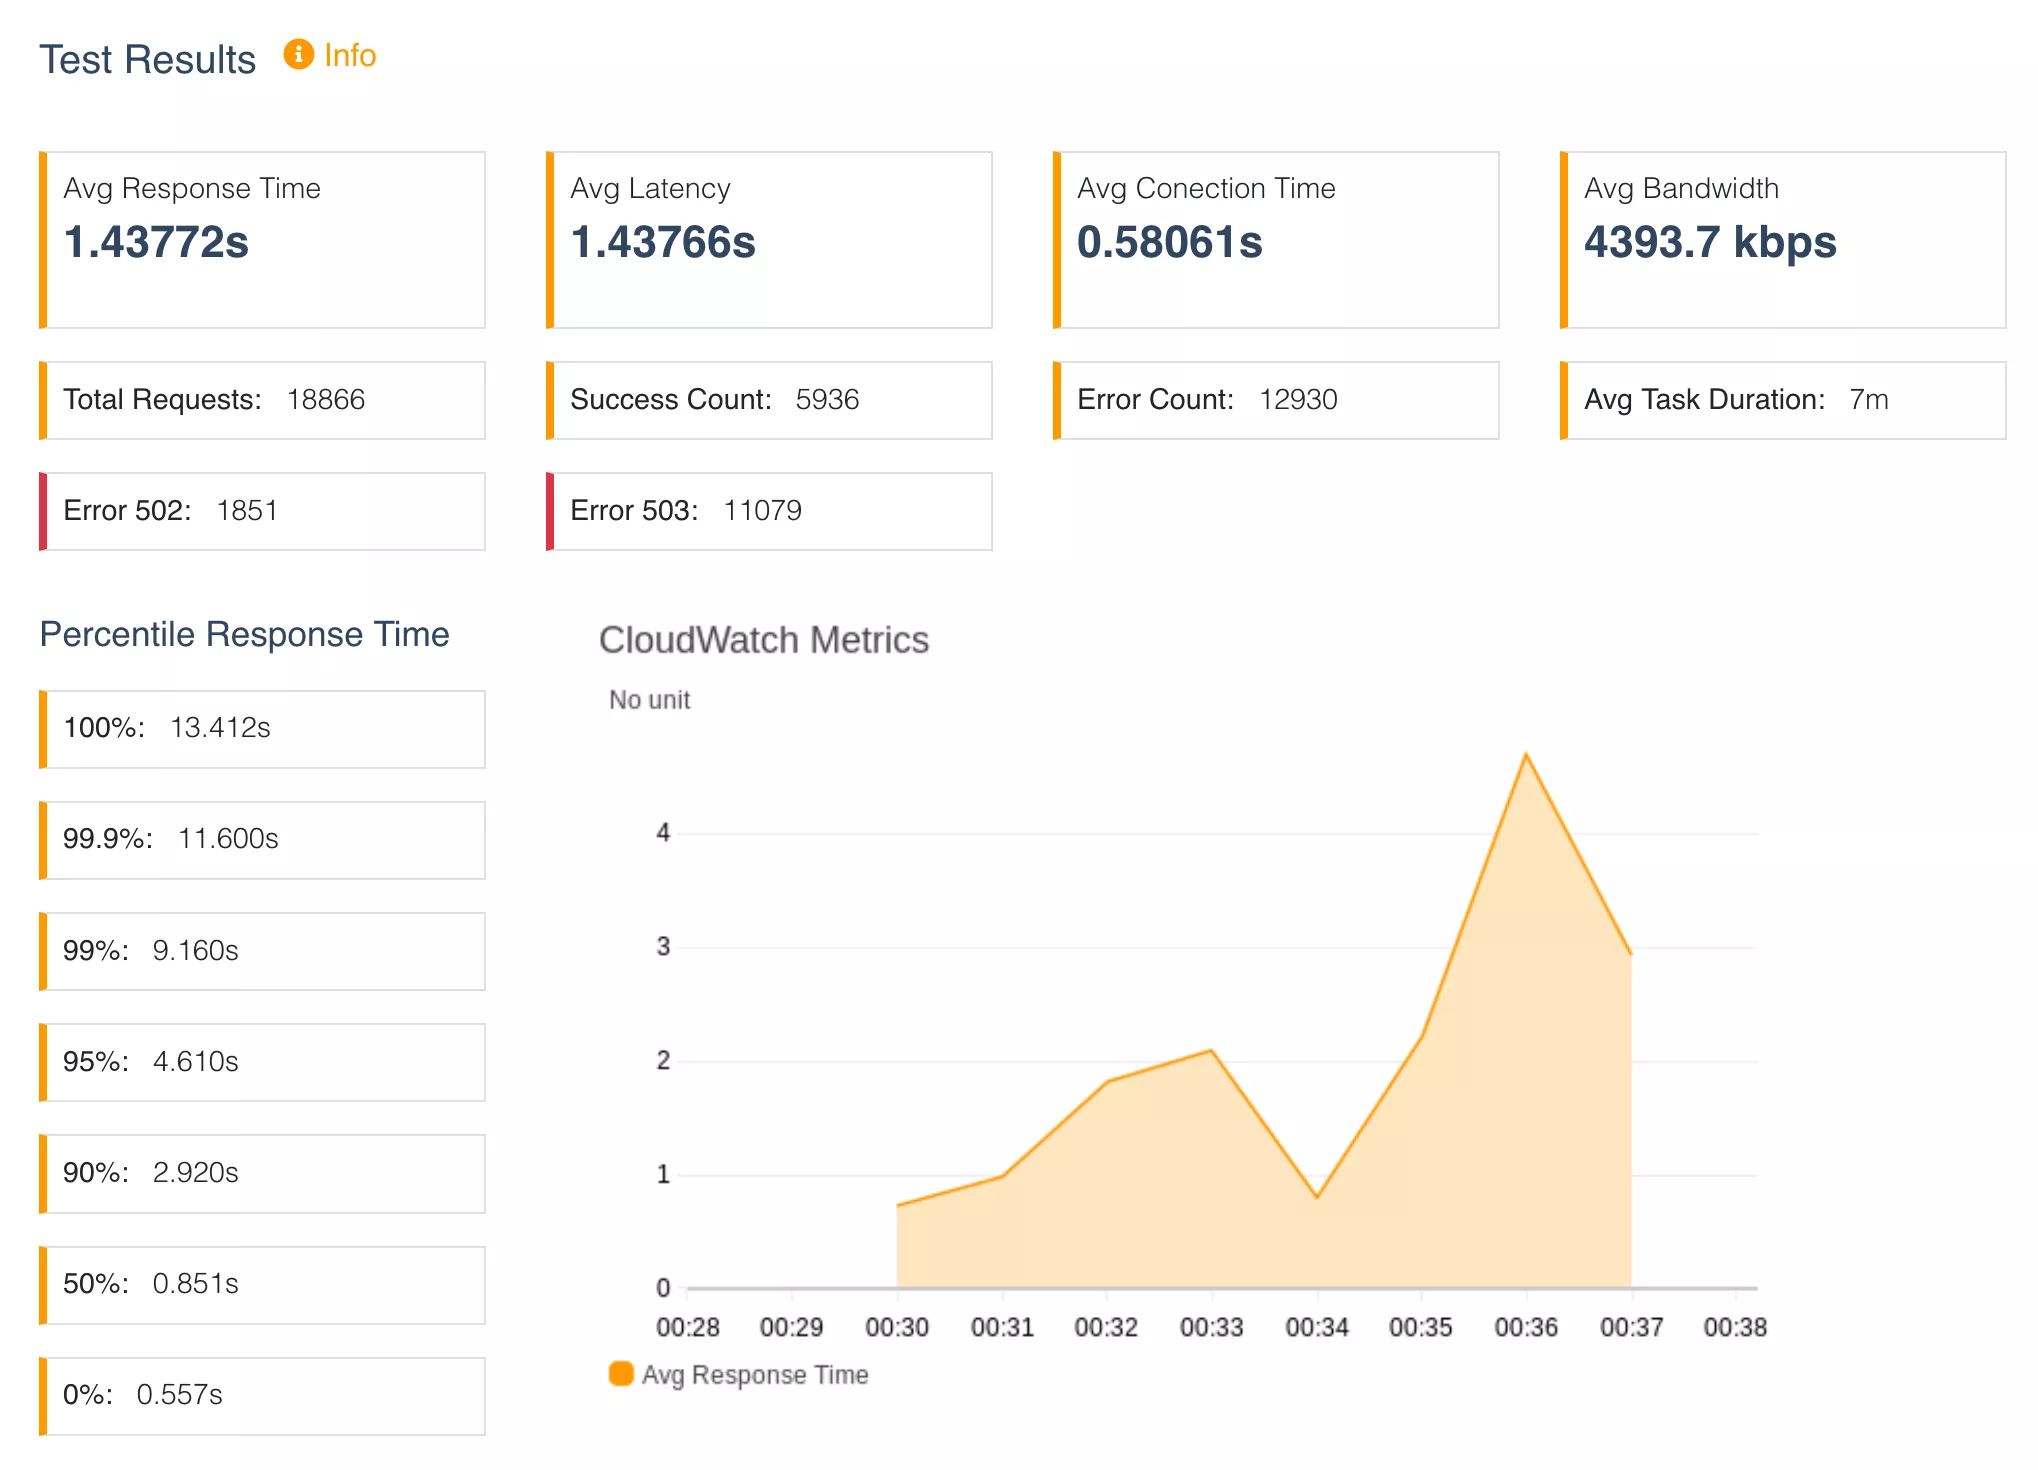
Out of 18,886 requests, 5936 (31.5%) were successful and 12930 (68.5%) failed. Observing the HTTP error codes, 1851 (9.8%) requests were HTTP 502 Bad Gateway server errors. 11079 (58.7%) requests were HTTP 503 Service unavailable server errors. We were able to sustain for around 3 minutes and then performance suddenly dropped off.
What happened?
At the three minute mark, our Application Load Balancer (ALB) marked our single node as unhealthy as HTTP health checks failed. We can see this in the ECS events:
Essentially we performed DDOS attack on our own service. The node's workers were all occupied serving requests and there was no workers available to serve the HTTP health checks. There is further evidence of this in the HTTP 502 errors which indicate requests were not able to communicate with our application backend. When the node was marked as unhealthy it was removed from service. From this point on, we observe HTTP 503 errors from the ALB because there are no nodes available to service requests.
This is a good indication of when a single node will become saturated. The saturation point for this API was a continuous stream of 60 concurrent requests. This is a fairly low number compared to the load other services can handle which can be attributed to the fact this is one of our most expensive APIs, a worst case. We were limited by the number of workers available on the node. To mitigate this, we could increase the number of workers available to our application server, increasing the capacity and throughput for a single node. We could also consider load-shedding to prevent an overload of the node and mitigate back pressure of upstream services (a database cluster, for instance).
However in this case, to maintain availability, we know the best practice from AWS is to Scale horizontally to increase aggregate workload availability.
Step 2 - Scaling Horizontally
Before we can perform a stress test on our system with horizontal scaling we need to determine our scaling policy.
The traditional wisdom for autoscaling is to first determine what resource your workload is bound by, and scale on that. CPU-bound applications should scale on CPU, IO-bound should scale on connections and Memory-bound applications should scale on memory, and so forth. It's not uncommon that your workload might have be constrained by two different resources, and in this case it makes sense to scale on both these resources. This is possible in ECS by using Metric Math to combine data from multiple CloudWatch metrics. An example of using this with ECS can be found here. A second, newer alternative in AWS is CloudWatch composite alarms to combine multiple alarms. The former combines metrics, the latter combines alarms.
At Assignar, we scale by using Metric Math but include step scaling so that we can scale aggressively if we encounter unexpected spikes. For our ECS service, we've opted to scale on CPU, Memory utilisation and RequestCountPerTarget.
I can offer one piece of advice when using multiple metrics to scale; only have one decision point for scaling. In other words, do not try and attach multiple scaling policies to your service. Combine your scaling into a single decision. This eliminates the possibility of thrashing, for example when scale out on CPU brings your average memory utilisation below your scale in threshold, and vice versa.
With our scaling policy set, we repeated the same stress test as the single node test, 0 to 100 requests ramping up over 5 minutes, which yielded the results below.
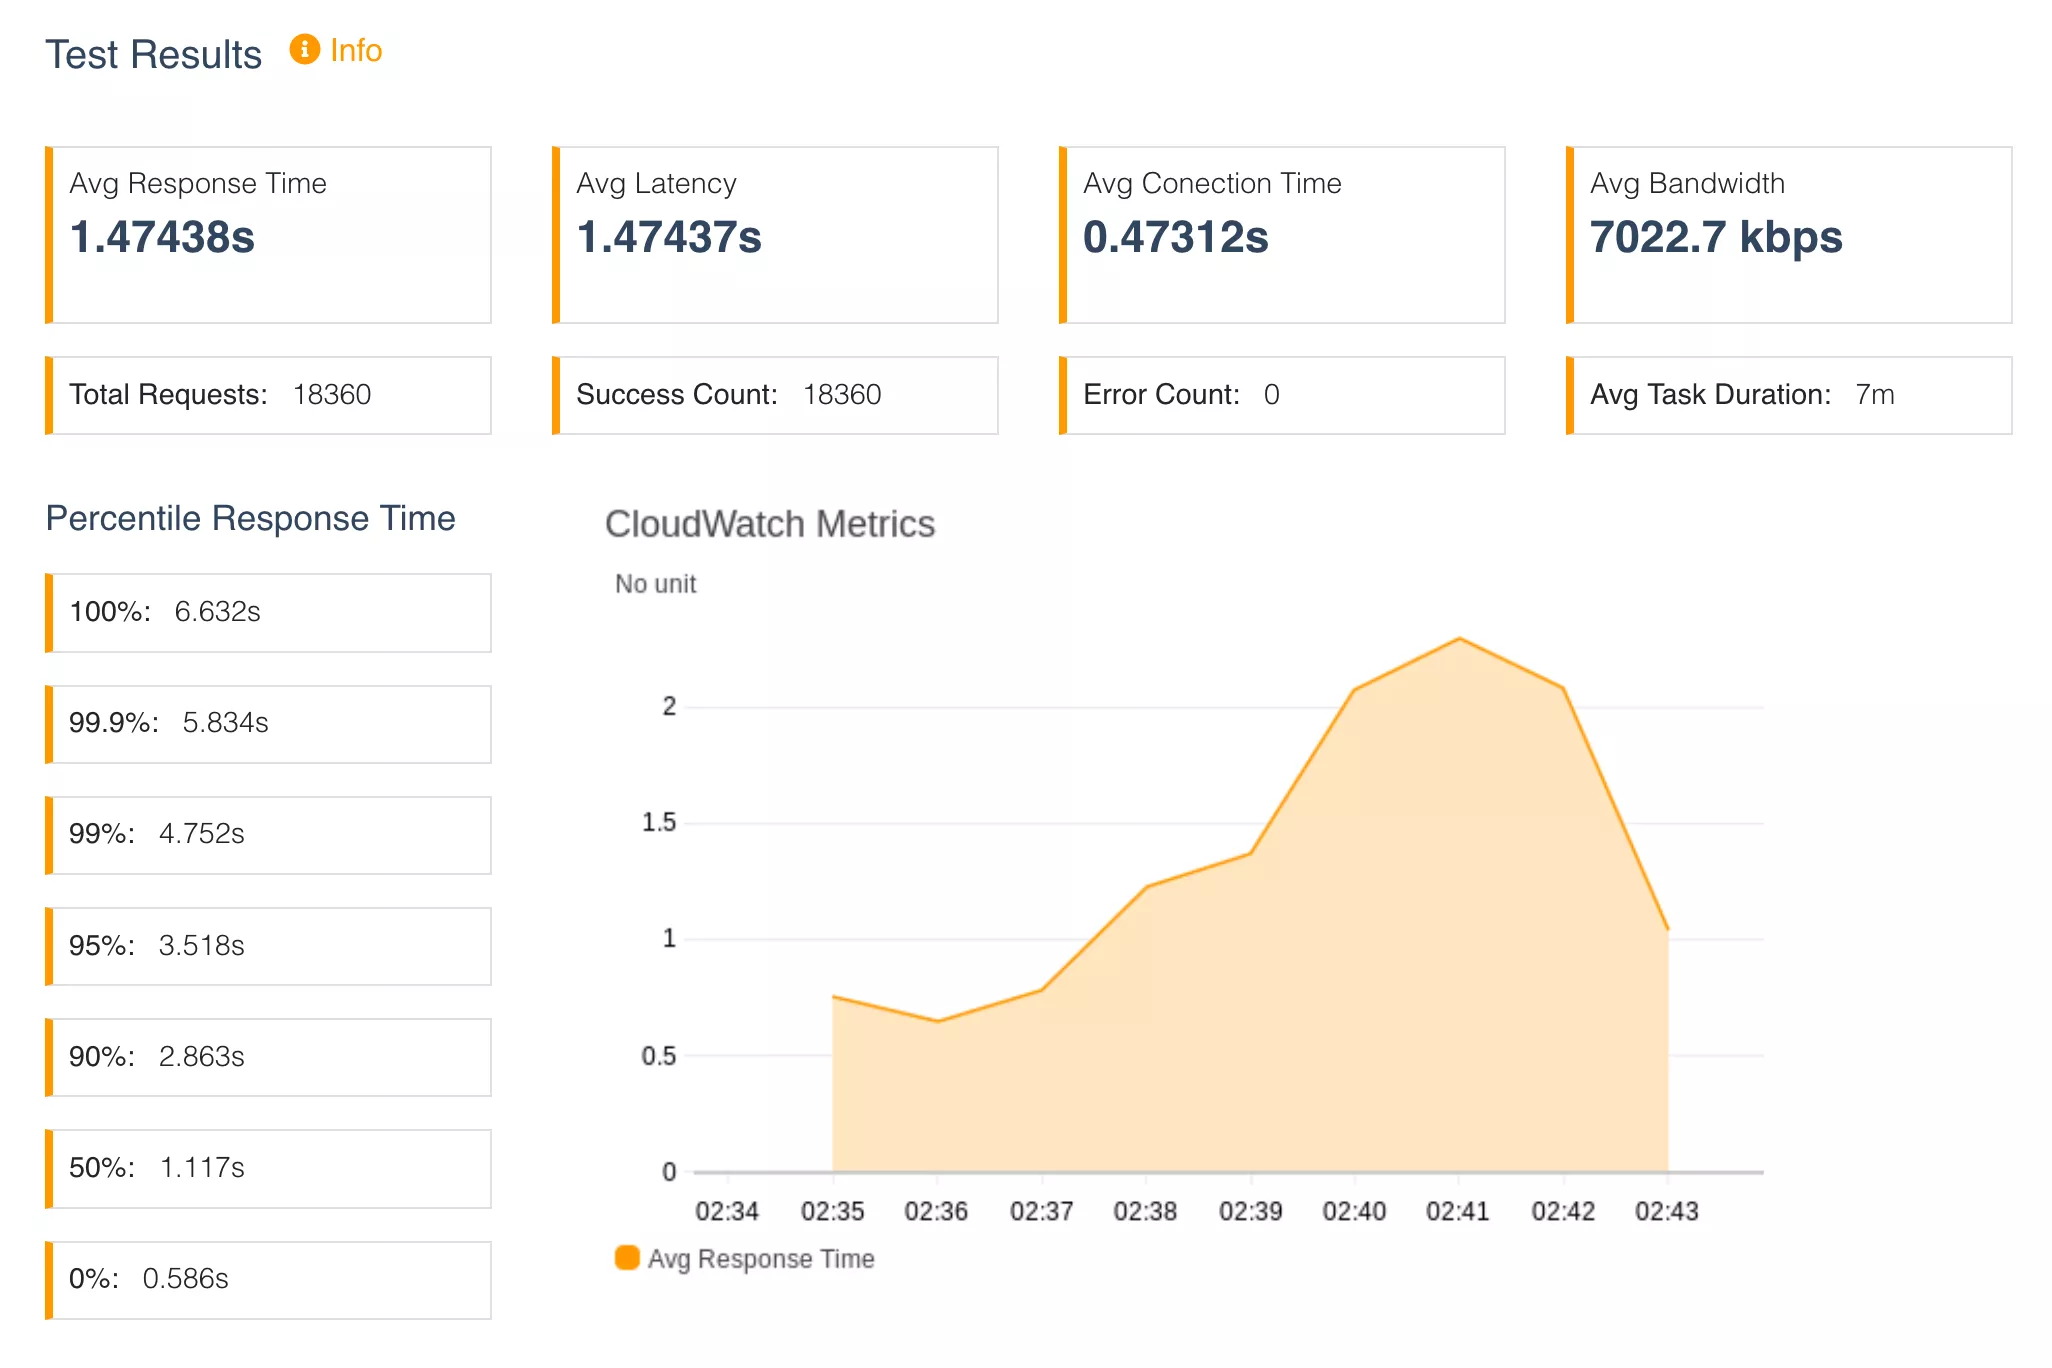
We see very similar behaviour to the single node test, where the response time increases as the load increase, but this time we were able to scale horizontally to handle the increasing load. As a result, in this test, 100% of requests were successful. We see the following message in the ECS service events, where we scale from 1 to 4 tasks:
A bug in our scaling policy
The first time we performed this stress test, it was surprising to find that scaling did not work as expected. We had a bug into our scaling policy by supplying the incorrect dimensions to our CloudWatch metrics. The metric expects the ALB and Target dimensions to be in the full name format whereas we were supplying these ARN format.
Incorrect ❌:
Correct ✅:
We expected to scale out when the RequestCountPerTarget breached our configured threshold. This was not the case. If not for the stress test, this error likely would not have been caught until after this feature was released to production, so at minimum stress testing can be useful as a sanity check that the infrastructure is working.
Stress testing with horizontal scaling
Having a working scaling policy, we now need to do a full stress test of the system system with horizontal scaling enabled.
For this test, we modified the ramp up to range from 0 to 800 concurrent requests. An 8x increase of load. The ramp up was also increased from 5 minutes to 20 minutes with a 4 minute hold time.
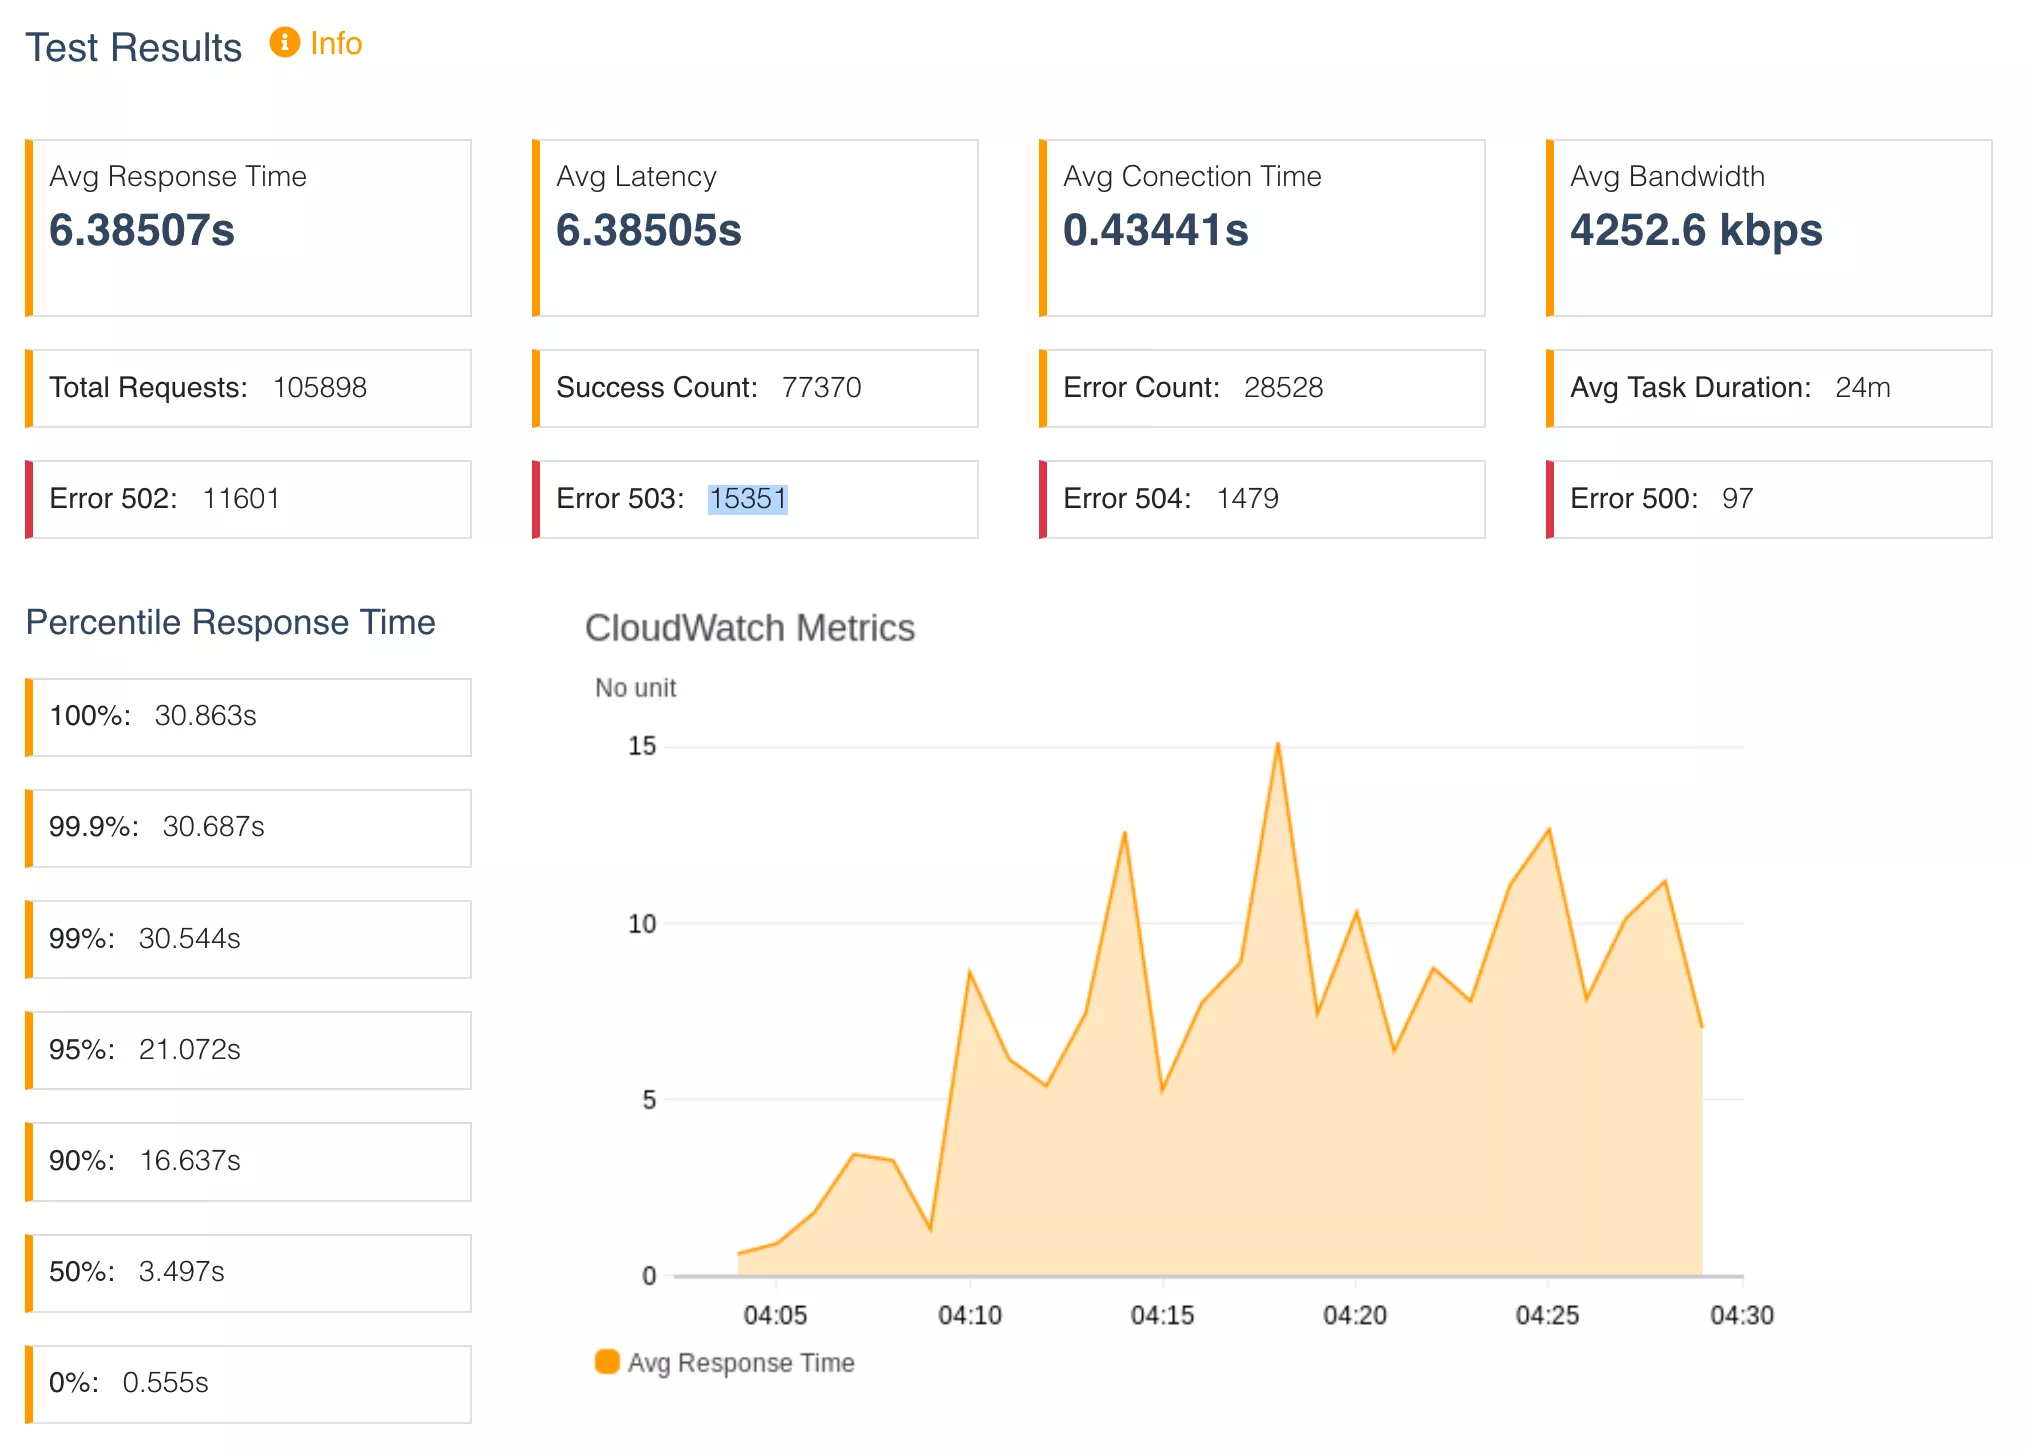
😱😱😱😱😱😱.
Under the additional load, only 73% of requests were successful, with 27% of requests returning error responses. In addition to 502s and 504s, we now also have 504s and 500s errors being thrown by the application.
What happened?
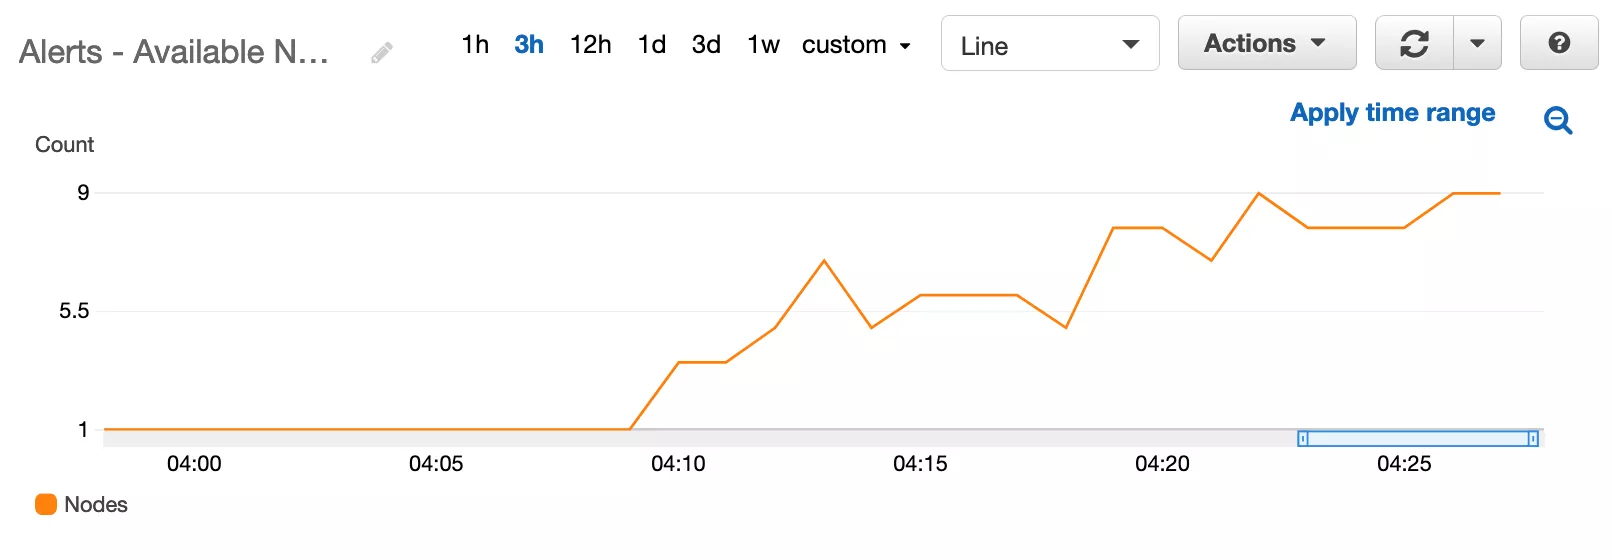
We are removing unhealthy nodes faster than we scale out which means there is a war between launching new nodes and removing existing nodes failing health checks. This is causing our application response times to fluctuate in sawtooth pattern, thrashing between error and success states. This is reflected in our ECS service statistics we the running count of nodes fluctuates in the same sawtooth pattern.
In the ECS events, we saw the same error we saw in the single node test, nodes are failing health checks.
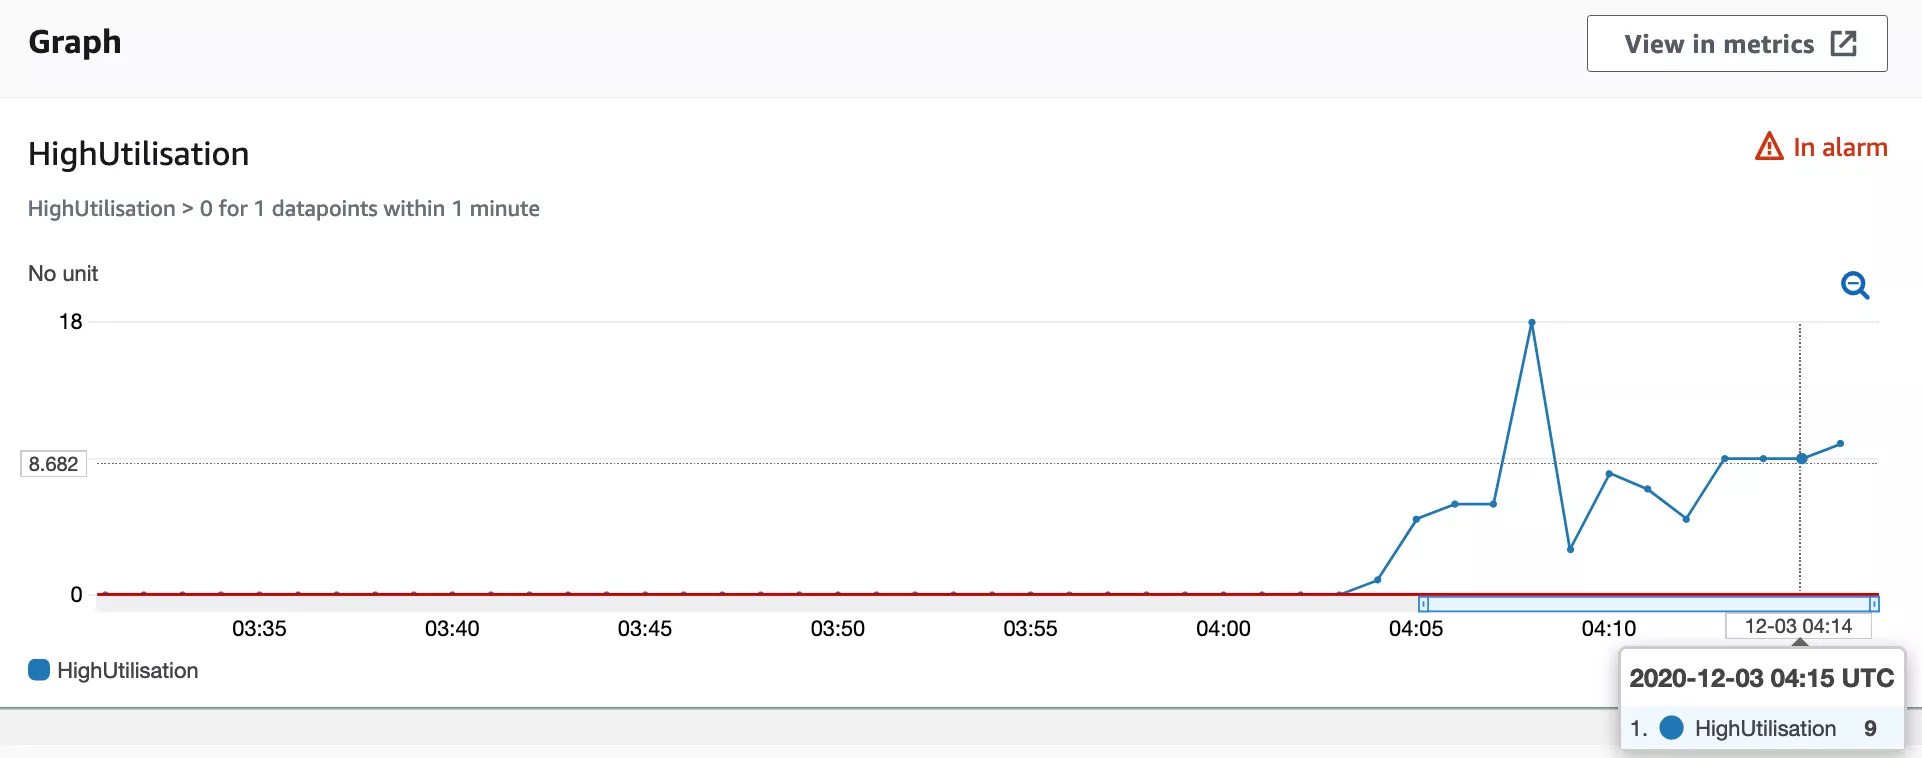
Our scaling policy is configured to calculate how many nodes to launch each scaling cycle, with a maximum of 3. During the stress test, the scaling policy was recommending we launch 9 nodes, however due to the cap of 3, we are only scaling a third of recommended amount the each scaling cycle. The cap was implemented to help smooth out the scaling curve and prevent overscaling, but in this case it has the opposite effect. The recommended amount of nodes over time can be seen below.
Stress testing helps us to understanding of the behaviour of new services. At Assignar, we embrace risk as part of our SRE mindset. Understanding our service limits and observing service behaviour is a critical. As a result of this exercise, various potential service improvements have been identified:
- Delay the scale-in of unhealthy nodes to allow time for new nodes to register and become available in service.
- Allow node health checks to query the application server in a separate queue to the production traffic.
- Increase the number of workers available to the application.
- Increase the maximum scale out during a scaling cycle to respond faster to an influx of requests.
Final thoughts
Stress testing is just one of the many strategies engineering teams have to build fault tolerant and high available systems. Stress testing is easy to overlook because it can be cumbersome to set up. Using AWS Distributed Load testing has simplified this process for us and i'll definitely be adding it to my arsenal.
References
- https://aws.amazon.com/solutions/implementations/distributed-load-testing-on-aws/
- https://www.bmc.com/blogs/n-tier-architecture-tier-2-tier-3-and-multi-tier-explained/
- https://en.wikipedia.org/wiki/High-availability_application_architecture
- https://docs.aws.amazon.com/whitepapers/latest/microservices-on-aws/serverless-microservices.html
- https://landing.google.com/sre/sre-book/chapters/monitoring-distributed-systems/
- https://docs.aws.amazon.com/wellarchitected/latest/reliability-pillar/design-principles.html
- https://www.webperformance.com/load-testing-tools/blog/2010/09/choosing-the-scenarios-for-a-load-test/
- https://loadninja.com/load-testing/
- https://en.wikipedia.org/wiki/Denial-of-service_attack
- https://wrongsideofmemphis.com/2013/10/21/requests-per-second-a-reference/
- https://aws.amazon.com/builders-library/using-load-shedding-to-avoid-overload/
- https://docs.microsoft.com/en-us/azure/architecture/best-practices/auto-scaling
- https://web.archive.org/web/20161227201811/http://techblog.netflix.com/2012/01/auto-scaling-in-amazon-cloud.html
- https://docs.aws.amazon.com/AmazonCloudWatch/latest/monitoring/using-metric-math.html
- https://marbot.io/blog/cloudwatch-combined-metrics.html
- https://docs.aws.amazon.com/AmazonCloudWatch/latest/monitoring/Create_Composite_Alarm.html
- https://docs.microsoft.com/en-us/azure/architecture/guide/design-principles/scale-out
- https://en.wikipedia.org/wiki/Thrashing_(computer_science)
- https://sre.google/sre-book/embracing-risk/
The following resources were not referenced but can be used as supplimentary material.
- https://www.getfilecloud.com/blog/an-introduction-to-high-availability-architecture/
- https://developer.squareup.com/blog/autoscaling-based-on-request-queuing/
- https://segment.com/blog/when-aws-autoscale-doesn-t/
- https://www.nclouds.com/blog/ecs-auto-scaling-here-is-what-you-need-to-know/
- https://aws.amazon.com/blogs/compute/automatic-scaling-with-amazon-ecs/