How to create Map Visualisation using D3.js

Nikita Sharma

Nikita Sharma

Data Science Intern

D3.js is a javascript library used to create interactive data visualizations in web browsers. D3 is very powerful and can create numerous different visualizations. D3 has a lot of available charts that we can choose from for our visualizations.

In this post, we will be creating a basic map visualization using D3.js.

Getting started with D3js

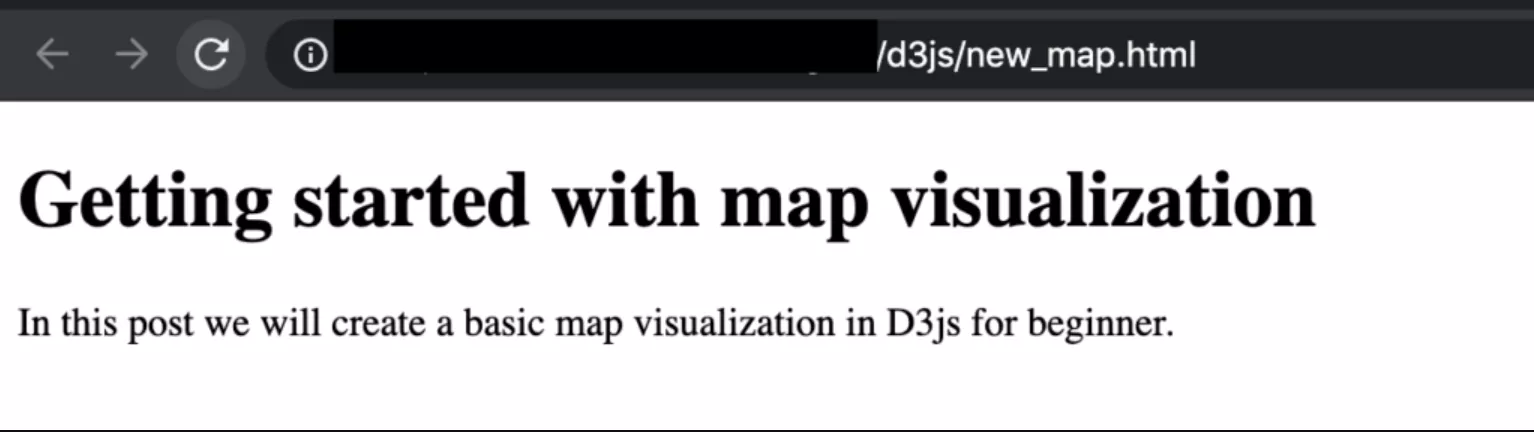
Here we will see how to start with basic text in D3js. D3js is a javascript library that can be used inside Html for visualization. Here is a minimal HTML page with the D3 library imported.

<!DOCTYPE html>
<html lang="en">
<head>
<script type="text/javascript" src="https://cdnjs.cloudflare.com/ajax/libs/d3/3.5.6/d3.min.js"></script>
<style type="text/css">
</style>
</head>
<body>
<h1>Getting started with map visualization</h1>
<p>In this post we will create a basic map visualization in D3js for beginner.</p>
</body>
</html>

getting started

Creating map visualization

So we know how to write simple text on D3js,  now we will see how to create simple map visualization.

Create required styles

Here we will use CSS (Cascading Style Sheets) that is used to define the styles of the web-page.

<style type="text/css">
body {
margin: 0;
background-color: whitesmoke;
font-family: 'Times New Roman', sans-serif;
font-weight: 300;
}
#svgcontainer {
width: 1000px;
margin-left: auto;
margin-right: auto;
margin-top: 50px;
padding: 5px 50px 10px 50px;
background-color: whitesmoke;
}
h1 {
font-weight: 800;
color: #5a7388;
font-size: 48px;
margin-bottom: 10px;
}
p {
font-size: 16px;
margin: 15px 0 10px 0;
}
svg {
background-color: whitesmoke;
}
</style>

In the above code, we have defined different styles of HTML elements. We can set different color, style, position, size, and many more to each of the element.

Create a canvas for our visualization

//Width and height
let w = 1000;
let h = 800;
//Create SVG
let svg = d3.select("#svganchor")
.append("svg")
.attr("width", w)
.attr("height", h);

This is where we are going to create our map visualization.

Draw Australia Map boundaries

//Define map projection
let projection = d3.geo.mercator()
.center([ 132, -28 ])
.translate([ w/2, h/2 ])
.scale(1000);
//Define path generator
let path = d3.geo.path()
.projection(projection);
let color = d3.scale.ordinal()
.range(['Azure']);

Here we are creating Australia Map boundaries by using D3 projection to locate Australia in the world map. Path generator will be used to locate the states of Australia which we will come soon. We are using a color range to fill different colors in different states. For now, we are just using 1 color but we can use a multi-color for every state.

Adding states to map with Geographic data

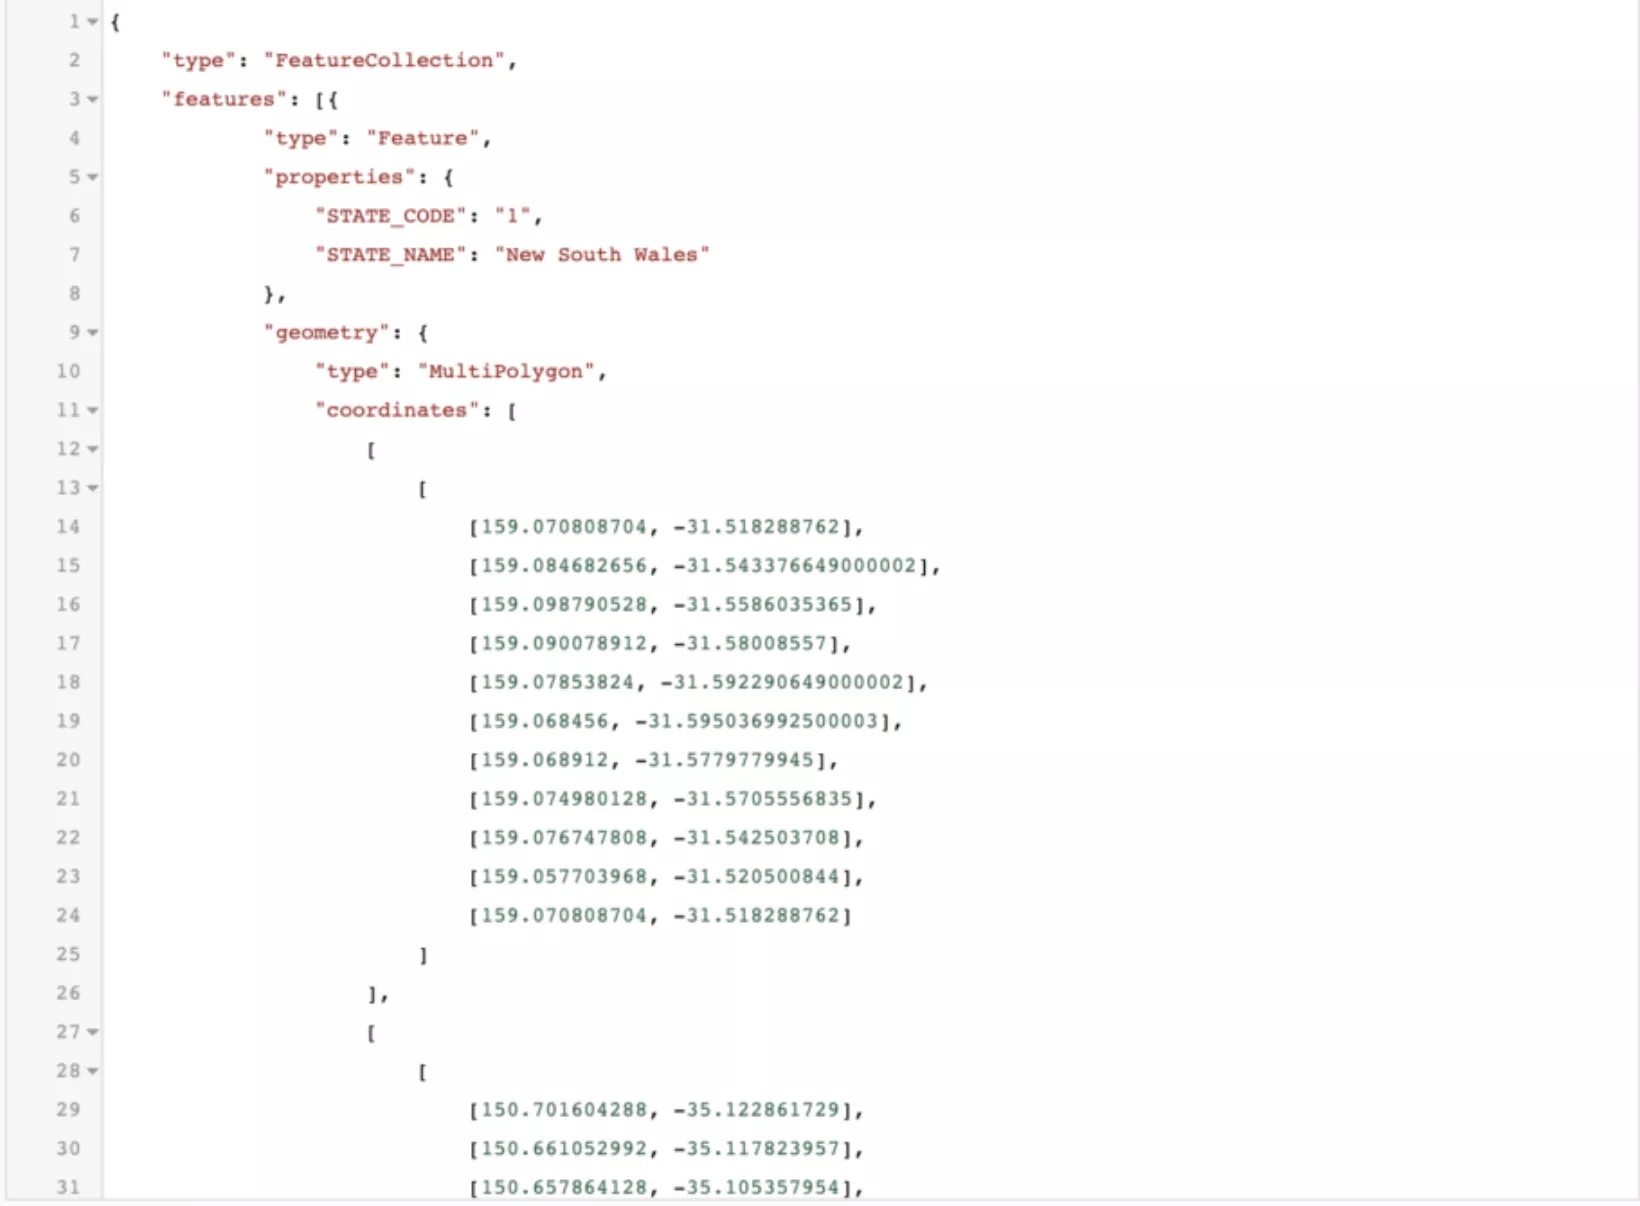
We need either geological or topological information to be able to plot the various states on the map. Thankfully this information is easily available in JSON format.

Here is a sample of Australia's geographical data, you can get the data from here.

geolocation data sample

We will load Geojson data in the following way.

//Loading GeoJSON data
d3.json("aust.json", (json) => {
//Binding data and creating one path per GeoJSON feature
svg.selectAll("path")
.data(json.features)
.enter()
.append("path")
.attr("d", path)
.attr("stroke", "dimgray")
.attr("fill", (d, i) => {return color(i)});
//States
svg.selectAll("text")
.data(json.features)
.enter()
.append("text")
.attr("fill", "darkslategray")
.attr("transform", (d) => { return "translate(" + path.centroid(d) + ")"; })
.attr("text-anchor", "middle")
.attr("dy", ".35em")
.text((d) => {
return d.properties.STATE_NAME;
});

Here we are creating the states in the map by loading the state location information. We are also extracting the state names from the loaded data and mentioning the names in the map.

All the code

<!DOCTYPE html>
<html lang="en">
<head>
<link href='https://fonts.googleapis.com/css?family=Roboto' rel='stylesheet' type='text/css'>
<meta charset="utf-8">
<title>Getting started with map visualization</title>
<script type="text/javascript" src="https://cdnjs.cloudflare.com/ajax/libs/d3/3.5.6/d3.min.js"></script>
<style type="text/css">
body {
margin: 0;
background-color: whitesmoke;
font-family: 'Times New Roman', sans-serif;
font-weight: 300;
}
#svgcontainer {
width: 1000px;
margin-left: auto;
margin-right: auto;
margin-top: 50px;
padding: 5px 50px 10px 50px;
background-color: whitesmoke;
}
h1 {
font-weight: 800;
color: #5a7388;
font-size: 48px;
margin-bottom: 10px;
}
p {
font-size: 16px;
margin: 15px 0 10px 0;
}
svg {
background-color: whitesmoke;
}
</style>
</head>
<body>
<div id="svgcontainer">
<h1>Getting started with map visualization</h1>
<p>In this post we will create a basic map visualization in D3js for beginner.</p>
<div id="svganchor"></div>
<br>
</div>
<script type="text/javascript">
//Width and height
let w = 1000;
let h = 800;
//Define map projection
let projection = d3.geo.mercator()
.center([132, -28])
.translate([w / 2, h / 2])
.scale(1000);
//Define path generator
let path = d3.geo.path()
.projection(projection);
let color = d3.scale.ordinal()
.range(['Azure']);
//Create SVG
let svg = d3.select("#svganchor")
.append("svg")
.attr("width", w)
.attr("height", h);
//Load in GeoJSON data
d3.json("aust.json", (json) => {
//Binding data and creating one path per GeoJSON feature
svg.selectAll("path")
.data(json.features)
.enter()
.append("path")
.attr("d", path)
.attr("stroke", "dimgray")
.attr("fill", (d, i) => { return color(i) });
//States
svg.selectAll("text")
.data(json.features)
.enter()
.append("text")
.attr("fill", "darkslategray")
.attr("transform", (d) => { return "translate(" + path.centroid(d) + ")"; })
.attr("text-anchor", "middle")
.attr("dy", ".35em")
.text((d) => {
return d.properties.STATE_NAME;
});
//Append the name
svg.append("text")
.attr("x", 0)
.attr("y", 340)
.attr("font-size", 90)
.attr("font-weight", "bold")
.attr("font-family", "Times New Roman")
.attr("text-anchor", "middle")
.attr("opacity", 0.5)
});
</script>
</body>
</html>

Map Visualization

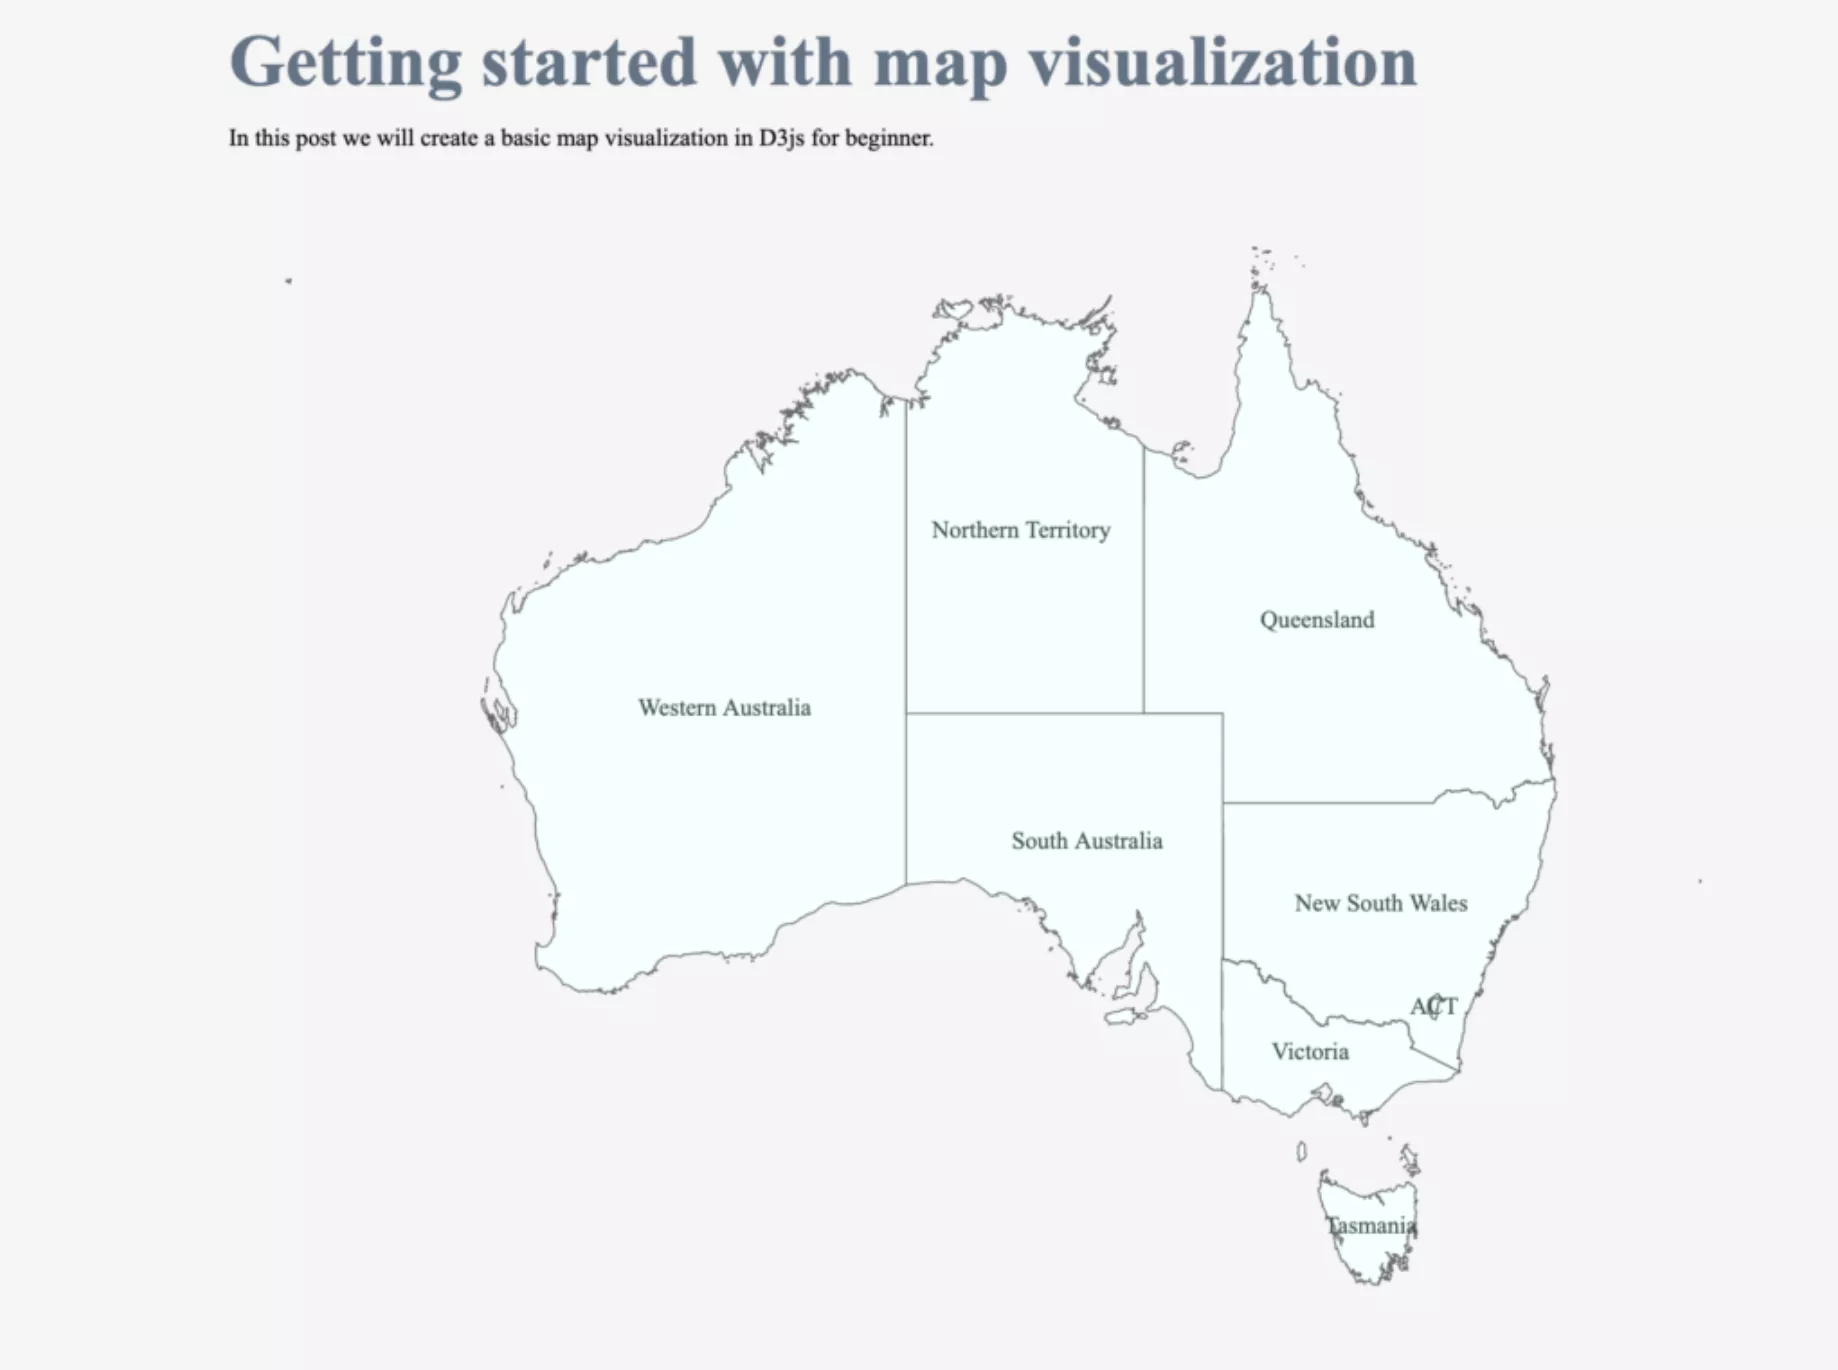
So this is how we can create a basic Australia map using D3. We can also plot maps for other countries in the same way as Australia map with their geological data.

Finishing Note

In this post, we learned how to plot basic map visualization in D3js. In the next post we will see how we can plot points on the map and also how we can make our map interactive.